Modeling Solar
Deep dive into solar energy system design and custom estimation tooling.
Backstory
A month ago, my wife and I made the monumental decision to leave our SF Bay Area apartment behind and set forth on a multi-year RV adventure. No home base, just full-time RV life. We’d already been exploring a more minimalist lifestyle, and I had recently quit my job to take a break and decide what’s next. While “sell everything, buy an RV, and hit the road” may not be the best plan for everyone, it felt perfect to us. Thus, we embarked on this exciting new phase of our lives. (You can read more about this story on my LinkedIn post.)
After a bit of research and searching through the used RV inventory of local dealers (always buy used!), we landed on a 2018 Keystone Cougar 311RES. This Cougar had solid bones and came recommended for full-time living due to its larger appliances and hookups for a washer/dryer. However, it was only equipped for operating under “shore power” (electrical hookups at RV sites). This was a problem for us, because we wanted the option to do something called “boondocking”: heading off into the proverbial “boondocks” where there is more privacy and beautiful scenery but no electrical, water, or sewer hookups. That meant no shore power.
In the decades past, RVs were often able to boondock using built-in or portable fuel-based generators, but those are noisy, smelly, and something we wanted to avoid. That led us to the modern holy grail of RV electrical power: solar. Solar panels have become significantly cheaper and more efficient in the last 10 years, and there are multiple options for panels, batteries, and mounting. Companies like Renogy sell complete kits for setting up solar for ultimately providing household-style AC electrical power. That’s what we wanted: silent, renewable, free energy (after an initial upfront cost).
Like many software engineers, my ability to build software gives me nonsensical levels confidence in my ability to build other non-software things. Fortunately, building out a solar panel and battery system isn’t rocket science, and with the help of RV forums and YouTube, I managed to overhaul the RV electrical system to support an 800-watt solar system with upgraded LiFePO4 (lithium) batteries and power source transfer switching. It was a challenging but rewarding project that taught me several new concepts I’d never explored, and it sent my mind down the boondocking rabbit hole of energy and resource management.


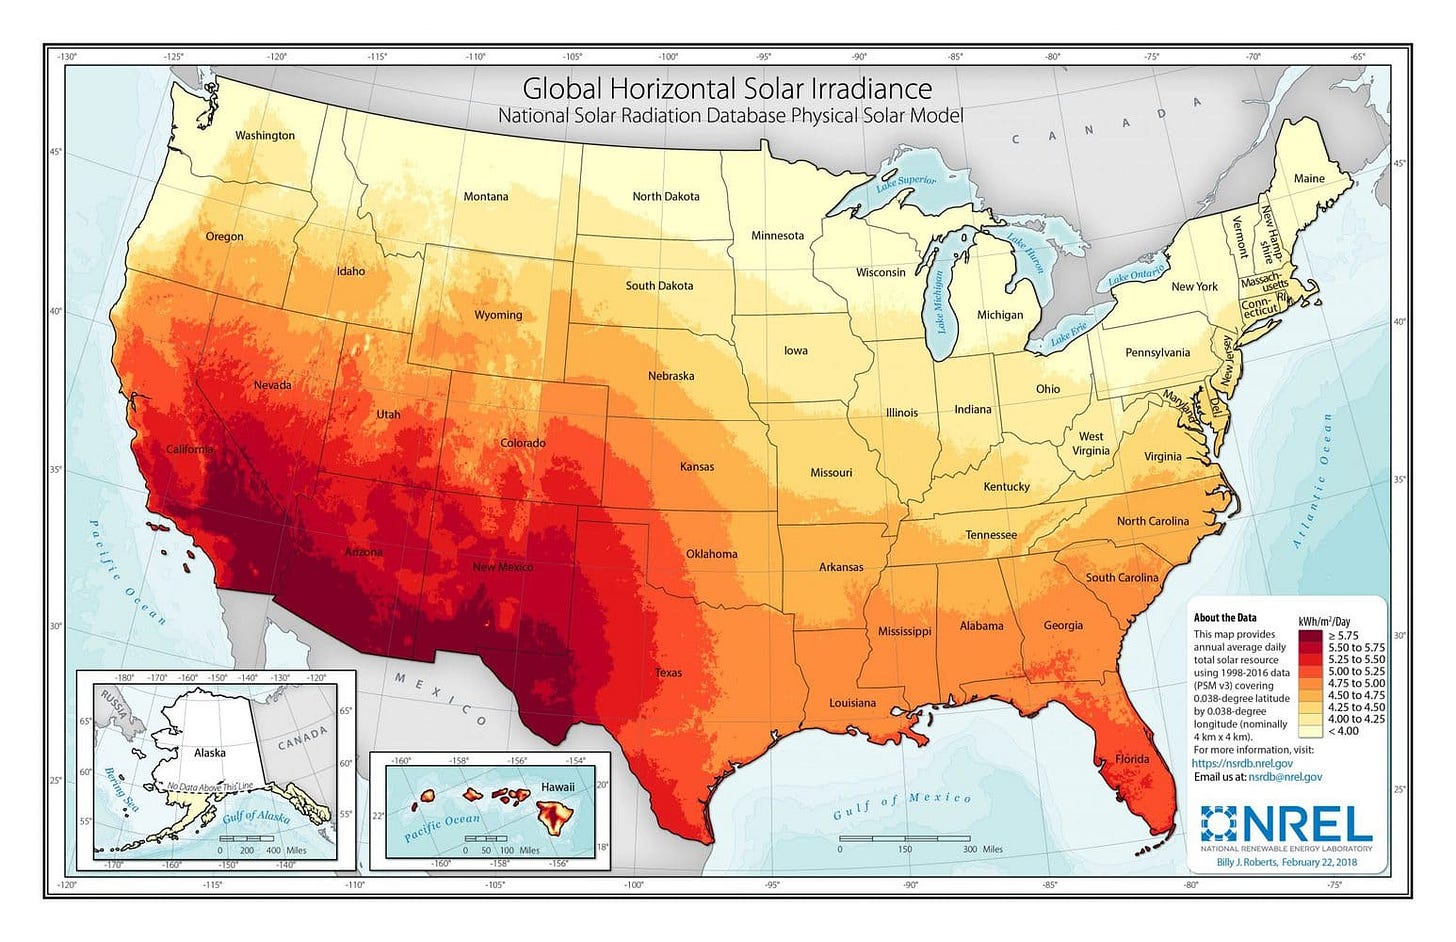
Through this project, I learned that sizing your solar panel array requires thinking far beyond the listed wattage output rating. When I first started this project, I thought a 400-watt solar panel system would be more than enough for what we needed. After all, it was the largest 12V solar panel kit sold by Renogy! Unfortunately, my initial assumptions were quite naive. Before committing to my original plan and facing ultimate disappointment, I luckily stumbled upon concepts like Peak Solar Hours, widely-varying solar efficiency due to location on the globe, and some handy functions for calculating overall solar system power generation. This led to the somber realization that a solar panel kit rated for 400 watts is rarely going to be generating 400 watts, and there are often only around 5 meaningful hours of power generation on even the sunniest day. I also learned that my first destination in northwest Washington state was within the worst region in the continental US for solar power generation due to low solar irradiance. Undeterred and unwilling to give up on the Pacific Northwest (one of my favorite regions to visit), I continued to research what equipment would be necessary for successful solar boondocking regardless of latitude or longitude.
Necessity is the Mother of a Coda-based Energy Consumption Calculator
One half of the energy equation is generation. The other half is consumption. In order to determine the boondockability of our rig, I needed to determine a more comprehensive way to measure of our energy consumption. Because I didn’t have the ability to hook up a watt meter to each outlet and perform a real-life test for of our computers, TVs, phone chargers, coffee grinders, etc.... over multiple days, I began simply searching for the rated wattage for each specific device we used on a daily basis. Fortunately, the wattage info can typically be found on the labels of each charger or plug (these labels list amps and volts, but you can multiply amps by volts to get wattage for a unified metric across devices).
With these calculations, we can’t just stop at watts. A watt is a measure of power, but we need to calculate energy, which is power over time. To estimate the demands on your solar array and battery bank, we need to determine watt-hours, the energy counterpart to watts. An example of such a calculation: if a device runs at 5 volts and 1 amp, then it runs at a power of 5 (5V * 1A) watts. If we run this device for 5 hours, it will consume 25 (5W*5hr) watt-hours of energy. To get an accurate representation of my energy demands over the course of a day, I would need to perform this type of calculation for all my devices and then sum up their average hours of use per day.
Unfortunately, these calculations can start to get a bit more complex for any realistic energy estimates. For instance, even if your phone is plugged in all day, it’s not actually going to be charging at full wattage all day. When it is charging, there’s a multi-phase charging profile at play, and this causes the charging wattage to vary. While this ultimately doesn’t matter much for a 5W device, similar non-linear energy usage exists for many devices (including major appliances like an A/C unit), and that can meaningfully affect energy calculations. Unfortunately, because all of these details are difficult to source for my dozens of devices, I just ball-parked energy usage based on the labeled wattage and average time the device is used during the day.
On the energy production side, solar energy isn’t going to be provided at a constant rate, and it’s only going to generate near its rated energy for a fractional portion of full daylight hours. Energy is going to be produced on a bell curve of intensity from dawn until dusk, and the shape of that curve is going to be dependent where you are in the globe (not to mention weather). To help simplify this calculation, organizations have calculated and published the number of Peak Solar Hours (PSH) for locations across the country. A Peak Solar Hour is defined as an hour in the day when the intensity of the sunlight reaches an average of 1000 watts/meter², and this value can be entered into a basic equation1 to estimate your solar array’s approximate daily energy generation. However, this tends to be a bit simplistic, and for a small mobile solar system like mine, I wanted more granularity to project hour-by-hour net energy availability throughout a 24-hour cycle.
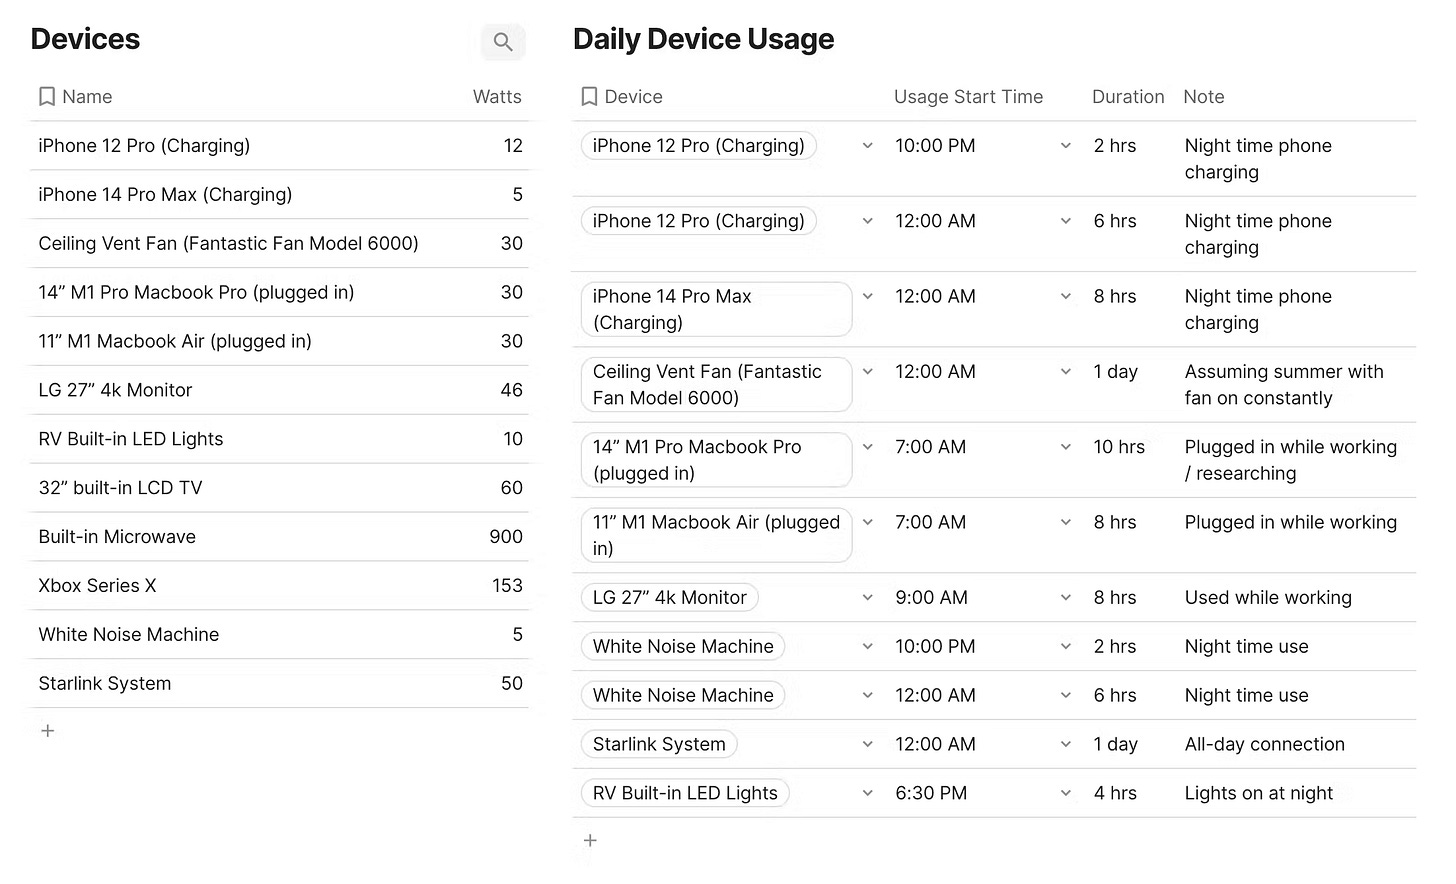
To begin visualizing my ongoing energy usage, I built a tool in a no-code/low-code interactive doc platform called Coda. I started off with a device table that contained a list of the electronics I used on a daily basis along with their watt rating. Referencing this table was a device usage table that mapped out time blocks of daily usage for each device. Using a Python script and the Coda API, I was able to process this data into 5-minute intervals of energy usage (although 5-minute intervals turned out to be granularity overkill). This Python script then wrote back table rows into Coda for each of those 5-minute intervals so I could effectively visualize my energy usage in a stacked bar chart.
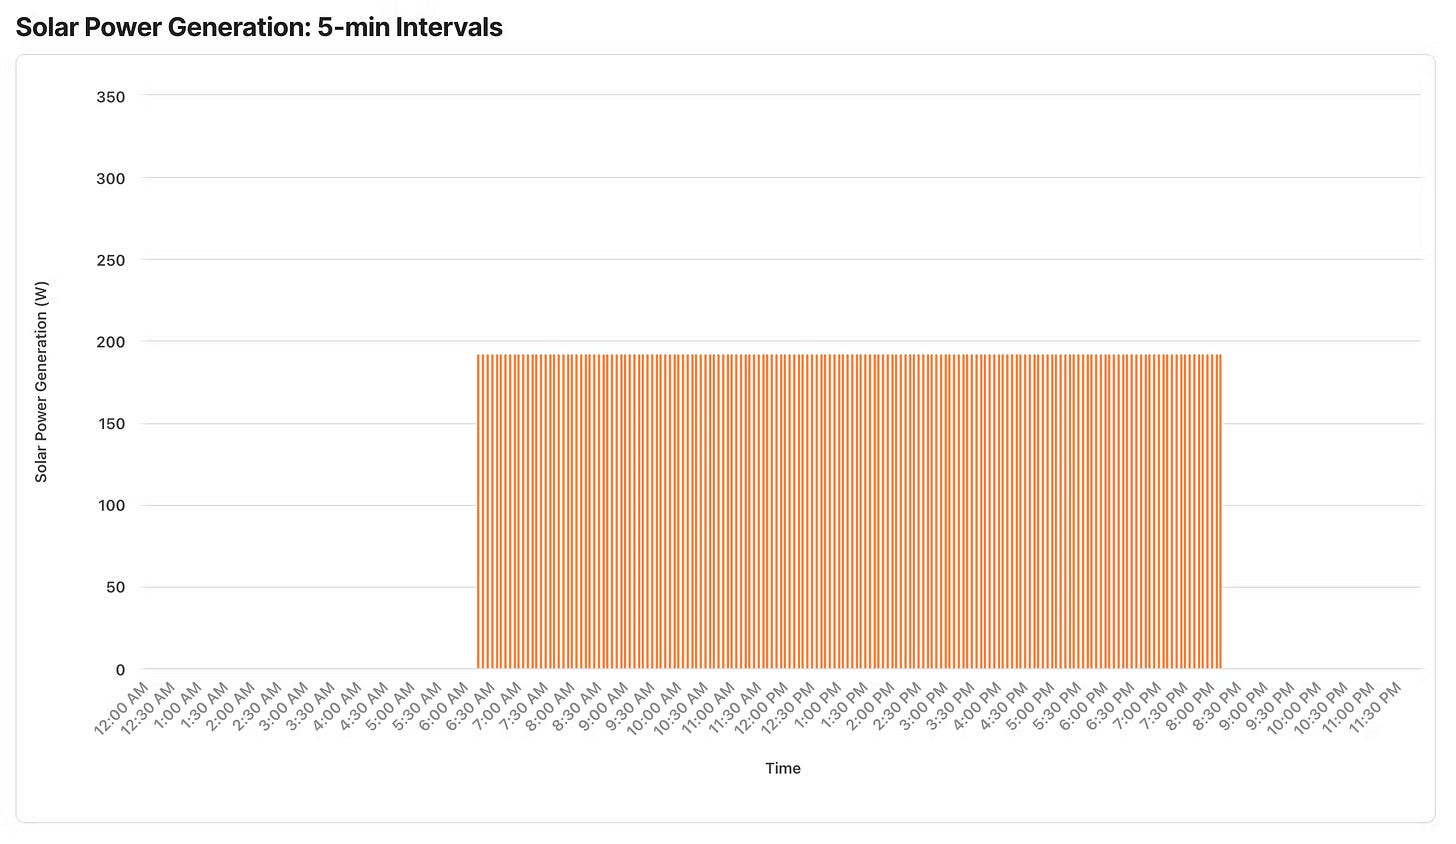
I then needed to compare usage with my system’s energy generation estimates. Ultimately, I needed to see if my solar array was capable of keeping up with my energy consumption. This is where I got a bit sloppy and came up with an over-simplified projection of Peak Solar Hours averaged over the course of the full daylight hours2. I also admittedly got a bit impatient and didn’t attempt to bring in any sort of solar energy bell curve, partially because I had difficulty sourcing what that curve looked like, and I didn’t have time to do any area-under-the-curve calculus nonsense to fake a bell curve based on Peak Solar Hours. Regardless, the resulting series of evenly-distributed energy production over time gave me some visual idea of what I’d be working with.
The screenshots above show the values calculated for a 800W solar panel array. As mentioned earlier, I’d expected to install only a 400W array, and in my hurry to get my RV set up, I ordered the 400W system without doing my due diligence. As you can see from comparing my estimated energy usage chart with the energy production chart for Seattle in August, I barely scrape by even with an 800W solar array. After using this tool to visualize my energy generation with only 400W of solar, I knew I had to double my system, and the most cost-effective course of action was to simply buy another 400W solar system and run them together in parallel.
Originally, I had also attempted to include my ritualistic hour of Xbox play during the evening. However, at 153 watts for the Xbox along with 46 watts for the screen, playing games on my Xbox simply drained far too much power, and that became very clear in these calculations. Using that much energy after dark would spell doom for my relatively small 200ah battery bank. It was a sacrifice I’d have to make. Time to read a book at night instead.
Speaking of battery banks, battery capacity calculation was one part of this tool that I never ended up building. I realized that to gain a more realistic understanding of my energy usage with battery banks in mind, I needed to handle multi-day scenarios, and that was beyond the scope of what I had time to build into this tool. Even so, that left me with some open questions: if my batteries were slowly depleted over the course of several days of incomplete charge, exactly how many days did I have before needing to find an alternate power source? Would it be worth sacrificing specific device usage, or was the battery depletion too gradual to matter for my length of stay? The more I dug into the data, the more helpful data I wanted to calculate.
Building an App: The Answer to All of a Software Engineer’s Problems
Seeing that there were no comprehensive tools available to perform these hour-by-hour energy calculations over multiple days, I began to brainstorm an idea for an app to help model out a solar energy system with these parameters in mind. It would extend upon my initial tool but provide more accurate data for solar generation curves, device electrical behavior, and more precise location-based solar data.
I’d like to build an app that makes it easy and intuitive to model out a rig’s mobile solar system (by picking or manually entering components) along with a building list of electronic devices and expected daily usage. After setting up a model of your rig’s energy system, you could enter multiple destinations and length of stay for an upcoming trip. Using advanced solar projection data for each location along with the stats on your current system, I’d like this app to produce an hour-by-hour energy usage and generation forecast for your upcoming trip while identifying bottlenecks (like too few batteries or insufficient solar panels) and suggesting energy optimizations.
Such an app could save many from an unexpected loss of electrical power in a location where there is no immediate remedy. Losing power can mean loss of refrigerated goods (even propane refrigerators need powered control boards), loss of income for those working remotely, and even jeopardize health for those who commonly travel with devices like CPAP machines.
For those planning their solar system builds, such an app could help realistically project their needs based on expected usage. Often, people overspend on solar because they want to be prepared, despite not understanding their own energy needs. And, of course, there are people like me who ultimately underspend. Having a realistic way of modeling energy usage under realistic circumstances can help many save time, money, hassle, and disappointment.
A Question
Do you have any personal experience with solar while RVIng or otherwise off-gridding? I’d love to get some feedback and any ideas on how I can better approach the problems I outlined above!
Actual Solar Output = Rated Solar Panel Output * Peak Solar Hours * 0.75 [an efficiency coefficient]
This was not a logical way to handle this projection in retrospect, but it gave me a general picture of available energy per 5-minute interval of daylight.


This is incredible. Thanks for sharing, Brian! I look forward to following along!